

Analysis has been undertaken of car ownership levels across Kent, and within the Ebbsfleet area, based on EDC’s own baseline travel analysis of 2017, and the 2011 Census data, to identify any trends between house types and tenures, neighbourhood density, and car ownership levels,
The map below shows the car ownership for all dwellings, regardless of size and tenure. In addition, the car ownership at 800m, 1.5km and 5km surrounding the local rail stations at Gravesend, Ebbsfleet and Dartford has been indicated by the circles.

Kent Car ownership : Average car ownership per dwelling in relation to rail stations at 800m, 1.5 km and 5 km.
The map identifies a direct relationship between car ownership and the centrality, connectedness and density of a neighbourhood, i.e. more central and better connected a neighbourhoods tend to have access to good local services, and thus the lower the number of cars owned by a household. Upon completion, the planned public transport, connectivity to local centres, and the availability of local services across Ebbsfleet will be equivalent to existing local centres, where the average car ownership is between 0.96 and 1.04 cars per dwelling. However it should also be noted that house types, densities and parking solutions are also different between these local centres and Ebbsfleet’s planned urban form, all of which will also impact car ownership levels.
“Two thirds of current households in Ebbsfleet own one car or less”
Household car ownership in Ebbsfleet
The tables below show data taken from household surveys of residents within the Ebbsfleet area. Table 1 shows the number of cars per household, which shows . The figures suggest that family formations within Ebbsfleet are consistent with neighbouring settlements and villages across
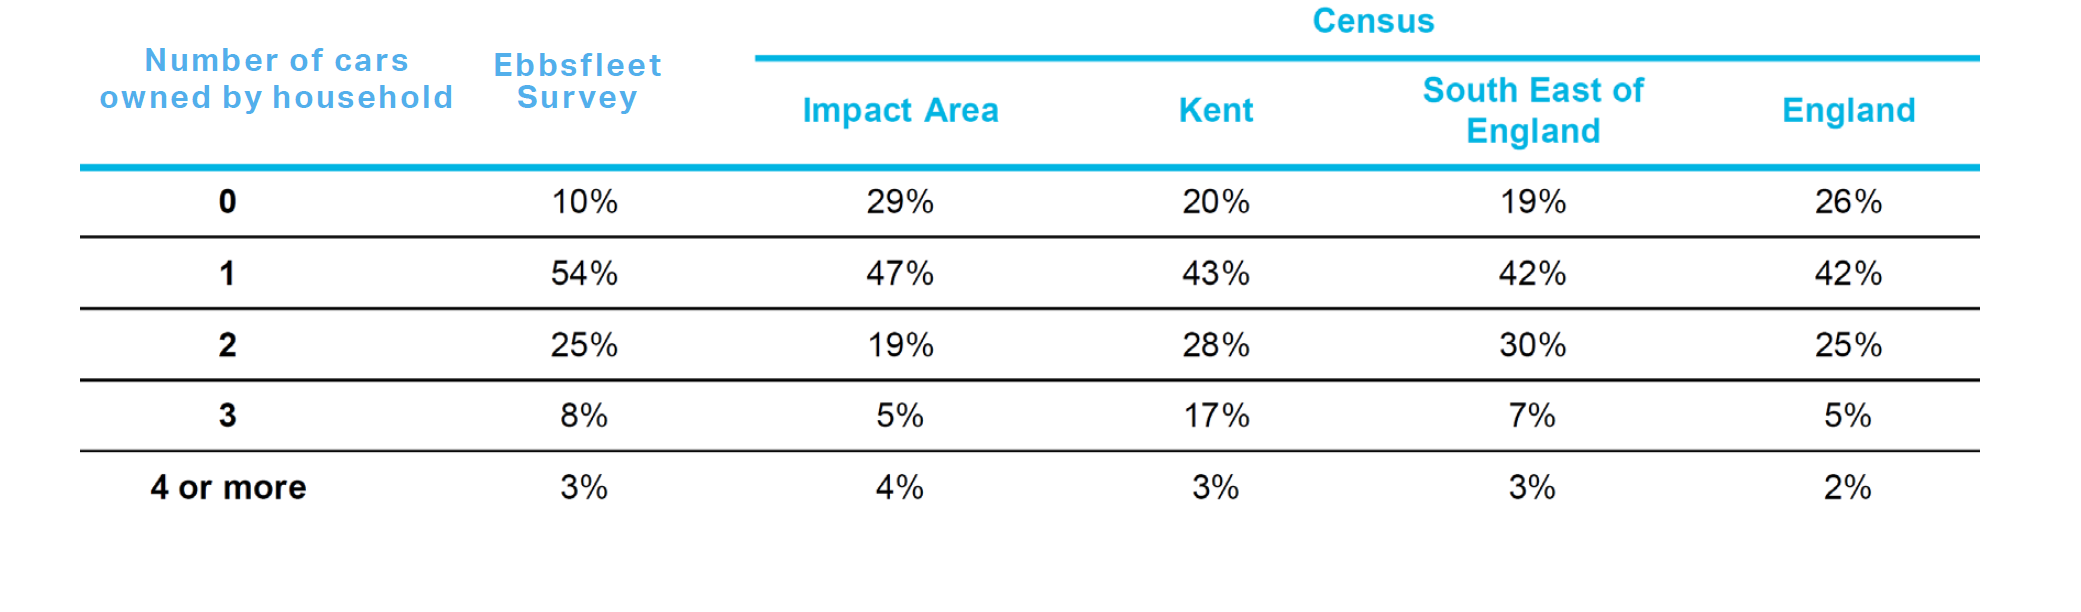
Table 1: Household car ownership in Ebbsfleet (2016 AECOM Baseline Report)
Household Composition
Table 2 shows the formation of households within the Ebbsfleet area. The figures suggest that family formations within Ebbsfleet’s new er villages are consistent with neighbouring settlements and villages in the area.

Table 2 : Household Composition in Ebbsfleet (2016 AECOM Baseline Report)